【置顶】技巧misc
qemu仿真出现Illegal instruction错误
使用qemu user mode运行单个程序时,可能会遇到Illegal instruction错误。尝试使用更新版本的qemu-mipsel-static,也还是存在类似的问题。
1 | $ file ./bin/busybox |
qemu-mipsel-static程序存在一个-cpu选项,可用于指定对应的CPU型号。以qemu-mipsel-static程序为例,支持的CPU型号如下。
1 | $ qemu-mipsel-static -cpu help |
通过尝试,当增加-cpu 74Kf选项时,可成功运行/bin/busybox,不会报Illegal instruction错误,如下。
1 | $ qemu-mipsel-static -cpu 74Kf -L . ./bin/busybox |
qemu仿真PIE程序获取加载基址
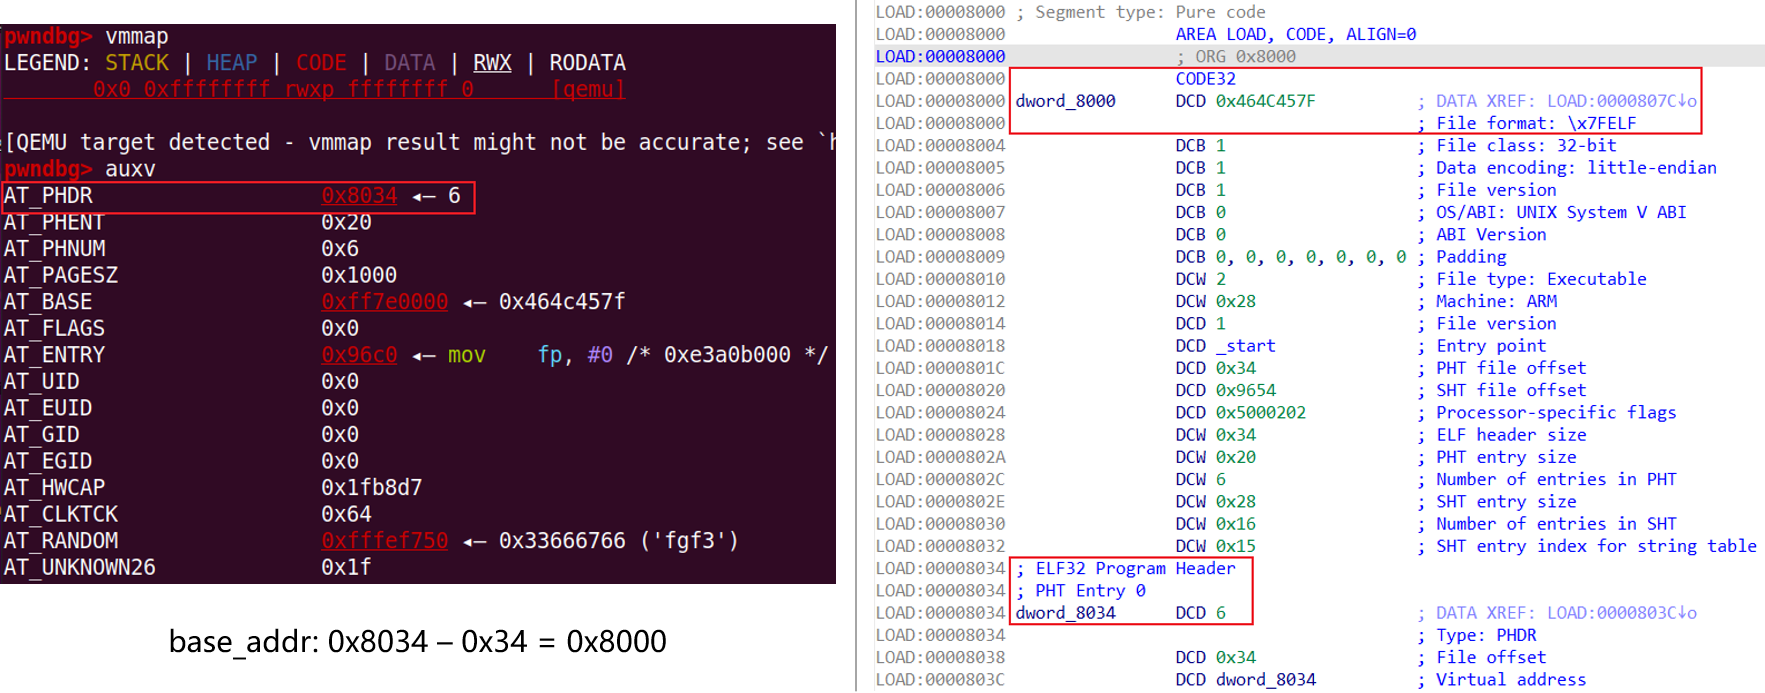
使用qemu user mode对单个程序进行仿真,若程序启用了PIE机制,使用常规的方式貌似无法查看其内存布局,由于不知道程序的加载基地址,造成后续无法下断点进行调试分析等。
使用较早版本的pwndbg插件中的vmmap命令可以查看,而新版中则会输出如下结果:0x0 0x0ffffffff rwxp ffffffff 0 [qemu]。通过查看pwndbg插件的代码,似乎由于代码变更,vmmap命令对qemu mode支持不太完善。
1 | # https://github.com/pwndbg/pwndbg/blob/dev/pwndbg/elf.py#L231 |
进一步查看vmmap命令的代码,发现其是通过AUXV机制来检测内存布局。
1 | # https://github.com/pwndbg/pwndbg/blob/dev/pwndbg/commands/vmmap.py#L35 |
经过测试,利用auxv命令可以获取到程序的加载基地址。具体地,利用auxv命令返回结果中的AT_PHDR字段的值,减去偏移,即可得到对应的加载基地址。
qemu仿真出现execve()错误
在使用qemu user mode对单个程序进行仿真时,经常会遇到类似"execve(): No such file or directory"的错误,其是因为在仿真的程序中又调用execve()来运行其他程序,而此时默认会使用x86/x86_64架构的ld来加载程序。
Linux内核有一个名为Miscellaneous Binary Format (binfmt_misc)的机制,可以通过要打开文件的特性来选择到底使用哪个程序来打开,比如文件的扩展名或者文件头的magic等。由于上述机制的存在,对于交叉编译后得到的静态程序,可以直接运行,当然通过
qemu_<arch>__static ./xxx的方式也可以运行。
解决上述错误有多种方式,最简单直接的方式是查看对应架构的binfmt_misc文件,然后将对应架构的qemu_<arch>_static拷贝到chroot后的interpreter路径。
感谢
@Ch1p提供的解决方案 :)
1 | 以arm架构为例 |
LD_PRELOAD: hook动态链接库函数
LD_PRELOAD是Linux系统中的一个环境变量,利用它可以指定在程序运行前优先加载的动态链接库,实现在主程序和其他动态链接库的中间加载自定义的动态链接库,甚至覆盖正常的函数。一般而言,程序启动后会按一定顺序加载动态库:
- 加载
LD_PRELOAD指定的动态库; - 加载文件
/etc/ld.so.preload指定的动态库; - 搜索
LD_LIBRARY_PATH指定的动态库路径; - 搜索路径
/lib64下的动态库文件。
在对嵌入式设备进行仿真时,经常需要进行环境修复,比如劫持与NVRAM相关的函数、hook某些函数使得程序继续运行不崩溃等。以qemu user mode为例,通过-E选项指定LD_PRELOAD环境变量,从而达到上述目的。
1 | sudo chroot . ./qemu-arm-static -E LD_PRELOAD='<custom_lib.so>' <binary_path> arg0 arg1 |
有时,使用LD_PRELOAD环境变量可能会不起作用,可以采用另一种方式:修改/etc/ld.so.preload配置文件,指定需要加载的自定义动态链接库。
通常,有2种常见的方式可以让
LD_PRELOAD失效(上面提到的情况不属于这2种):
- 静态链接
- 设置文件的
setgid/setuid标志:有SUID权限的程序,系统会忽略LD_PRELOAD环境变量
最后,推荐两个常用的用于hook的第三方库,代码及实现比较优雅,可以直接拿来使用或者参考借鉴:
libnvram:固件仿真框架Firmadyne中提供的用于模拟NVRAM行为的动态库,支持很多常见的api,同时还会解析固件中自带的一些默认键值对;preeny:支持很多常见的api,包括socket相关、fork()、alarm()、rand()等。
相关链接
- libnvram
- preeny
gdb命中断点后继续运行
在使用gdb进行调试时,有时侯想让程序命中断点执行一些操作后继续运行,比如dump指定内存地址处的内容、记录执行过的基本块地址等。在gdb中,让程序命中断点执行一些操作后继续运行,常见的方式如下:
define hook-stop方式1
2
3
4
5
6gdb
b *0x12345678 # set breakpoint
define hook-stop
x/4wx $esp # custom gdb command
continue
endcommands命令1
2
3
4
5
6
7
8
9
10# gdbinit
b *0x12345678 if (($rbx >= 0x600) && ($rbx <= 0x700))
commands
silent
set logging file ./malloc_trace.txt
set logging on
printf "malloc(): %p (size: 0x%x)\n", $rax, $rbx
set logging off
c
end自定义
gdb.Breakpoint1
2
3
4
5
6
7
8
9
10# custom_gdb.py
class MyBreakpoint(gdb.Breakpoint):
def stop(self):
# do what you want
return False # continue automatically
MyBreakpoint("*{:#x}".format(0x12345678))
# gdb
> source custom_gdb.py
其中,在hook-stop中运行continue命令似乎仅在第一次有效,后续命中断点后还是会停下来。后面两种方式是比较推荐的。
另外,如果只是想在命中断点后,打印指定内存地址处的内容,一种更好地方式是直接使用dprtinf命令,其原理是设置断点(dprintf类型),然后调用printf输出,之后再继续运行行。
1 | dprintf location,template,expression[,expression…] |
相关链接
- How to continue the exection after hitting breakpoints in gdb?
- User-defined Command Hooks
- Events In Python
- Manipulating breakpoints using Python
- Dynamic Printf
- gdb events example
IDA命令行运行idapython脚本
在IDA GUI中可以通过执行idapython脚本来完成一些特定的工作,如果需要对多个程序执行相同的操作,一种方式是在IDA GUI中逐个程序执行对应的脚本,另一种更优雅的方式则是通过IDA命令行进行自动化批量分析。
以Windows平台为例,针对单个程序,通过命令行自动执行idapython脚本的步骤如下:
调用
idat.exe/idat64.exe对程序进行初始分析,生成对应的idb文件1
2
3
4
5
6processor type
x86/x86_64: metapc
arm: arm/armb
mips: mipsl/mipsb
PowerPC: ppcl/ppc
"<ida_path>" -A -B -L"<log_file>" -p<processor_type> -o<idb_path> <binary_path>基于生成的
idb文件,运行对应的自动化脚本1
"<ida_path>" -A -S"<script_path> <arg1> <arg2>" -L"<log_file>" <idb_path>
添加
-L<log_file>选项,便于查看和定位idapython脚本中的错误
其中,idapython脚本中通过ARGV[i]来获取传递的参数,同时最后通过调用idc.Exit(0)退出。
1 | arg1 = ARGV[1] |
Linux平台与Windows平台类似,但存在细微差别:1) ida可执行程序变为idal/idal64;2) 在命令行参数最开始加上TVHEADLESS=1,最后可加上 > /dev/null。
1 | TVHEADLESS=1 "<ida_path>" -B -p"<processor_type>" -o"<idb_path>" "<binary_path>" > /dev/null |
另外,推荐一个nccgroup开源的框架idahunt,其支持对二进制文件进行批量分析,也能执行idapython脚本,功能比较强大,感兴趣的可以看看。
附件下载
相关链接
- IDA Help: Command line switches
- idahunt: a framework to analyze binaries with IDA Pro